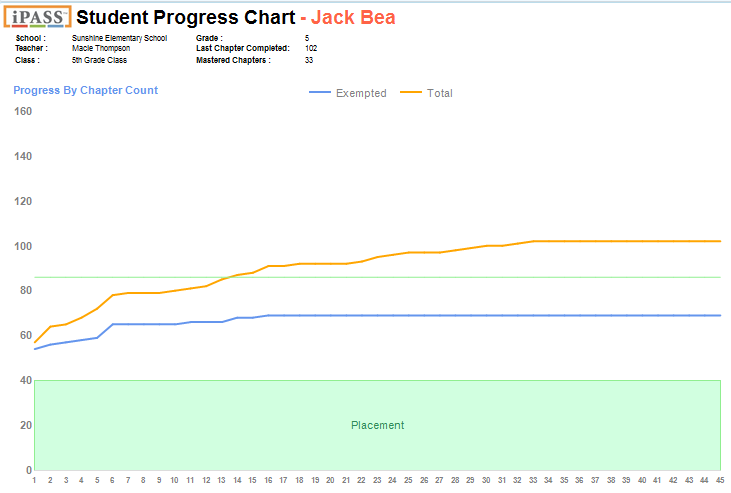
The Student Progress Chart is available at the teacher and student levels. It displays the student's progress toward the end of the enrolled grade level by chapter and by percent. Below the report is shown at the teacher level.
This report displays information for one student.
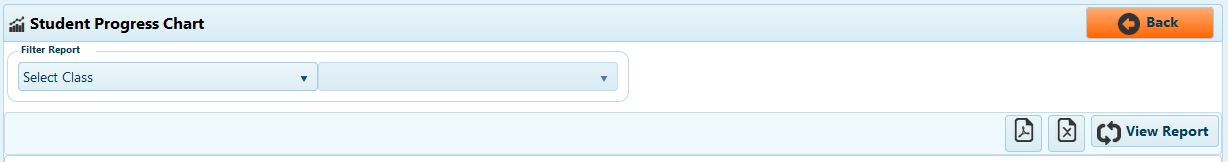
Select Class - Click "Select Class," then choose the class.
Select Student - Select student from the alphabetical list.
View Report - Always click "View Report" after making changes. A reminder will display in which you can click "View Report."
Export - Export to PDF or Excel.
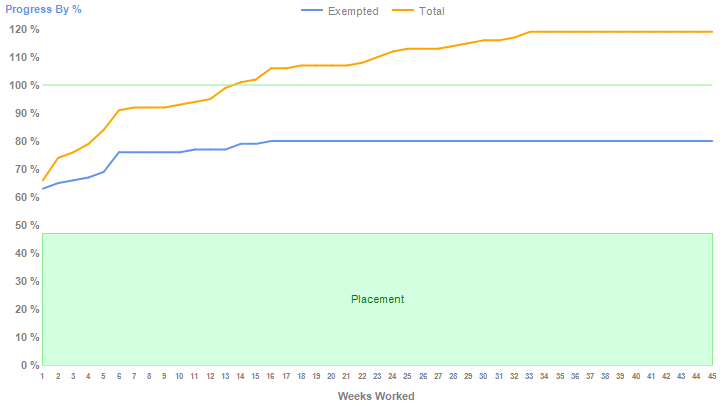
The report will display two charts: Progress by Chapter Count (first chart above), and Progress by % (second chart above).
Exempted - The blue line represents the number of chapters or the % of chapters the student exempted in iLearn Math.
Total - The orange line represents the total number of chapters or the total % of chapters the student completed in iLearn Math.
Placement - The green area at the bottom represents the number of chapters or the % of chapters the student exempted during the Placement Test process.
Goal Line - The green line represents the last chapter in the student's enrolled grade, or 100% of the goal. The student above is a 6th grader, and there are 100 chapters from 1st grade to the end of 6th grade.
The vertical difference between the Exempted line and the Total line represents the cumulative number of chapters in which the student completed instruction and practice, and met the chapter mastery test requirements.
Use this report to see a visual reference of progress toward and beyond goal in iLearn Math over time.