The Screening Summary report is available at the teacher, school, and district administrator levels. It allows educators to view results on a specific Universal Screening assessment assigned to students. In the example below, the Screening Summary report is described at the teacher level.
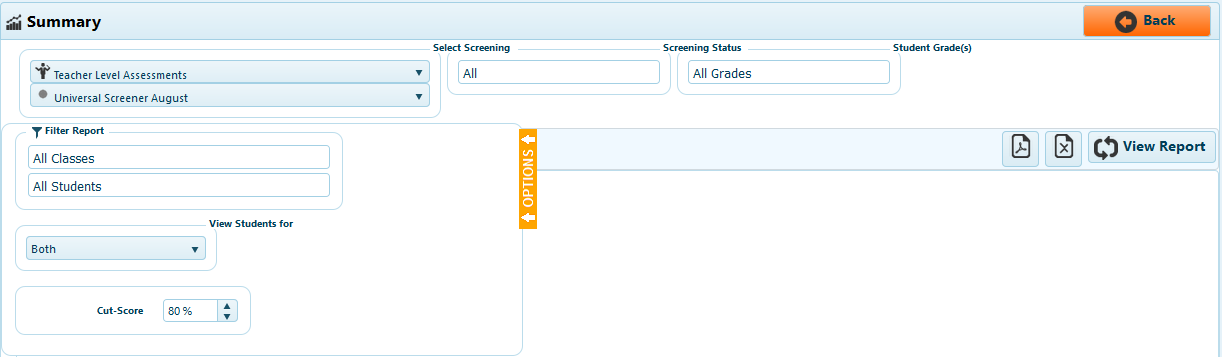
After selecting "Screening Summary," you can run the default report by clicking "View Report," or you can alter the options.
Assessment Level - Choose the level at which the Universal Screening assessment was assigned. Teachers, school administrators, and district administrators.
Screening Name - Choose a specific Universal Screener to view by clicking this drop down menu, and selecting the name of the Universal Screener you would like to view. (Universal Screeners assigned by school administrators will end with the school administrator's name in parenthesis.)
Options - Customize the report you would like to run by clicking "Options" on the left hand side. A slide out window will appear and you can choose the fields you would like to alter.
Select Class(es) - Select one or multiple classes you would like to see. If you would like to look at only one specific class, click "All Classes" and choose the class you would like to view. If you would like to compare two or more classes, click "All Classes" and choose the classes you would like to compare. You can remove classes by clicking the "x" next to the class name. You can include as many classes as you have the ability to see.
Select Student(s) - Select one or multiple students you would like to see. If you would like to look at only one specific student, click "All Students" and choose the student you would like to view. If you would like to compare two or more students, click "All Students" and choose the students you would like to compare. You can remove students by clicking the "x" next to the class name. You can include as many students as you have the ability to see.
View Students for - Choose to view students for only Teacher of Record, only Virtual View, or both.
Cut-Score - The Cut-Score determines the recommended start grade for a student in iLearn Math and Assignments. The default is 80%; you can change the Cut-Score to any level. The recommended start grade is the next grade level after the highest grade level above the Cut-Score. For instance, if the cut score is at 80% and a 4th grade student scores a 100% on the first grade test, a 90% on the second grade test, and a 65% on the third grade test the recommended start grade for that student is 3rd grade.
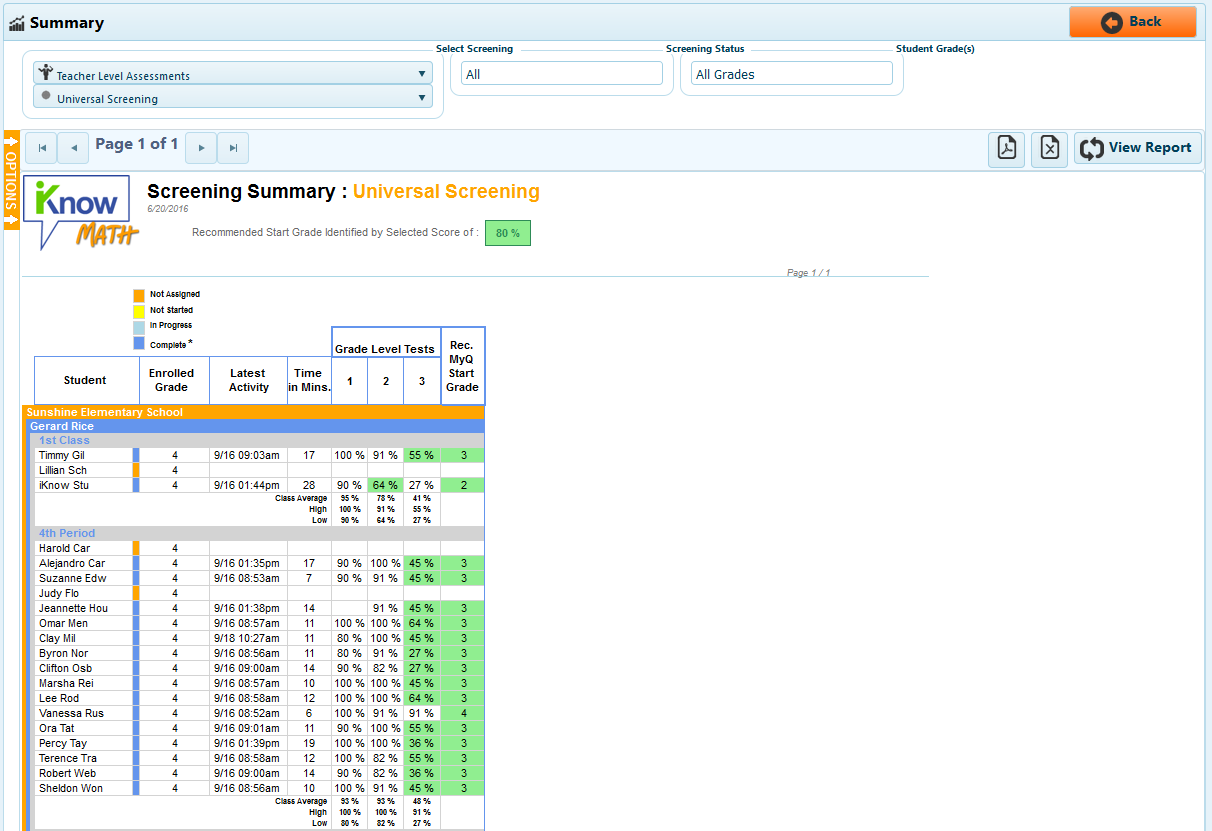
4. View Report - After setting up the report to view, click "View Report." After clicking "View Report" educators can alter the report by changing the options. Remember, always click "View Report" after you have changed options. From the options you selected, the Screening Summary report will run and play.
Color Coding - The screening summary will color code each student's progress, so you can quickly see who has finished testing, and who needs to continue testing.
Not Assigned - Students who were not assigned to the selected Universal Screener will display an orange bar.
Not Started - Students who have been assigned the selected Universal Screener, but have not started will display a yellow bar.
In Progress - Students who have not scored at least 90% or have not tested down to grade level one will display a light blue bar.
Complete - Students who have scored either 90% or have tested down to grade level one in the selected Universal Screener will display a dark blue bar.
Green Highlighting and Rec. Start Grade - The green highlighted cells and the "Rec. Start Grade" will always show the same grade level. The recommended start grade is based on the Cut-Score and is determined by how well a student performs on a grade level test. (If many of your students are starting too low, change the Cut-Score.)
Grade Level Tests - The score the student achieved on each grade level test in the Universal Screening assessment. Some students may need to take only a few tests, whereas other students students may need to test all the way down to grade 1. use this report while students are testing to monitor how far down each student should test.
Export - Export to PDF or Excel.
Use the Screening Summary report to quickly see how well students performed on any Universal Screening assessment assigned, and quickly determine a student's proficiency in math below their current grade level.